Water


BACKGROUND ON WATER SYSTEM

Return to homepage...
Where Your Drinking Water Comes From
History of the Water System
Where Your Drinking Water Comes From
Understanding Your Baltimore City Water Bill
Water Project Details
New Water, Sewer Rates Allow Progress
Water Meters
Water

WATER CONSTRUCTION PROJECTS

Affected Properties & Project Details
Where Your Drinking Water Comes From
Understanding Your Baltimore City Water Bill
Water Project Details
New Water, Sewer Rates Allow Progress
Water Meters
Water

AFFECTED PROPERTY MAP
Explore Neighborhood Map

WATER SYSTEM NEWS / INFORMATION

Meeting Our Future Water Needs
New Water, Sewer Rates Allow Progress
Where Your Drinking Water Comes From
Understanding Your Baltimore City Water Bill
Water Project Details
New Water, Sewer Rates Allow Progress
Water Meters
Water

PRESS RELEASES


Where Your Drinking Water Comes From

Clean, quality drinking water is essential to the health and safety of our customers and our City. We provide drinking water to 1.8 million people daily throughout Baltimore City and to portions of Baltimore, Anne Arundel, Carroll, Harford and Howard Counties.

We manage three reservoirs and the surrounding lands that protect those water resources. And we provide treatment and filtration of those waters to the highest quality standards. In fact, we meet all requirements mandated under the Safe Drinking Water Act.

Baltimore is an old city and so are its water distribution pipes—many exceeding 100 years in service. Major capital investment is required to proactively maintain our system, to meet the demands of a growing regional population, and to meet federal regulations mandating system upgrades.

Quick Facts
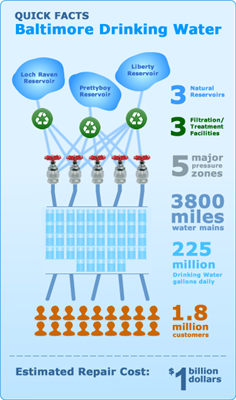
  • We serve 1.8 million customers throughout the region.
  • We deliver on average 225 million gallons of drinking water daily.
  • We manage 3 reservoirs—Loch Raven, Prettyboy and Liberty.
  • We manage 3 filtration/treatment facilities at Ashburton and Montebello.
  • There are 3,800 miles of water mains.
  • Our system pressure is gravity driven in many areas, but we also maintain pumping stations and elevated tanks to sustain 5
    major pressure zones for water distribution regionally.
  • Baltimore City and County pay essentially the same cost for water; they are billed differently, which can give the appearance of
    differing costs.
  • Current repairs are estimated to exceed $1 billion dollars

Factsheet
Where Your Drinking Water Comes From
(Size: 843 KB)
Click here to preview

F or more information, call 311 or email publicworks@cleanwaterbaltimore.org .